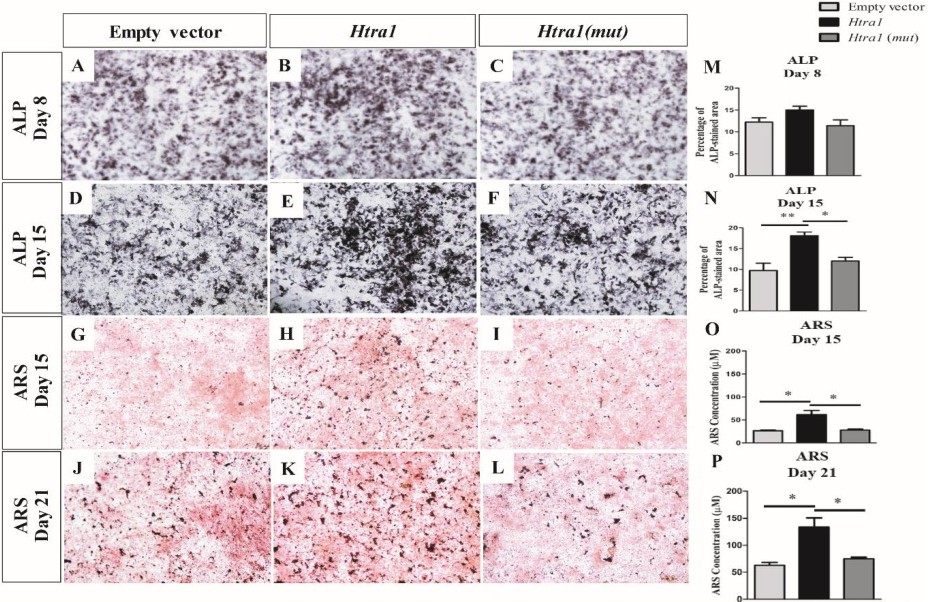
Fig. 2. Htra1 promotes osteogenic differentiation of primary mesenchymal progenitor cells. (A-F) Representative images of ALP staining in primary mesenchymal progenitor cells transfected with empty vector (A and D), Htra1 (B and E), and Htra1 (mut) expression vectors (C and F) at d8 (A-C) and d15 (D-F) of osteoblast differentiation. Overexpression of Htra1 resulted in an increase in ALP staining at d15, compared to the empty vector- and Htra1 (mut)-transfected cells (D-F). (G-L) Representative images of ARS staining in primary mesenchymal progenitor cells transfected with empty vector (G and J), Htra1 (H and K), and Htra1 (mut) (I and L) expression vectors at d15 (G-I) and d21 (J-L). ARS staining revealed an increase in mineralized matrix in Htra1-overexpressed cells, compared to cells treated with empty vector or Htra1 (mut) at both d15 and d21 (G-L). ALP-stained percentage area was quantified by ImageJ analyses at d8 (M) and d15 (N). Data are represented as mean ± S.E.M; one-way ANOVA with Bonferroni posthoc test; *, p<0.05; **, p<0.01 (n=4 biological replicates). Quantitation of ARS-stained osteoblast matrix after overexpression of Htra1 (n=3 biological replicates) revealed a significant increase in the amount of bone matrix in Htra1-overexpressed cells at d15 (O) and d21 (P), compared to both empty vector- and Htra1 (mut)-transfected cells. Data are represented as mean ± S.E.M; one-way ANOVA with Bonferroni posthoc test; *, p<0.05. Scale bar=100 µm.